The Kubernetes Dashboard is a web-based user interface (UI) that provides a graphical interface for managing and monitoring Kubernetes clusters. It allows users to view, deploy, and manage applications, as well as monitor the health and performance of the cluster.
To access the Kubernetes Dashboard in MicroK8s, you can follow these steps:
Ensure that MicroK8s is running on your system. If not, start MicroK8s by running the following command:
microk8s startRelated: How to install microk8s
Enable the Kubernetes Dashboard:
microk8s enable dashboardRetrieve the access token for the dashboard by running the following command:
microk8s kubectl -n kube-system get secret | grep default-tokenThe output will include the name of the secret associated with the default token for the dashboard.
Extract the token from the secret by running the following command, replacing it with the name obtained in the previous step:
sudo microk8s kubectl -n kube-system describe secretLook for the token: field in the output, and copy the token value.
Start a proxy server to access the dashboard:
sudo microk8s dashboard-proxyThe proxy server will run in the foreground, and you can keep the terminal open.
Open a web browser and navigate to the following URL:
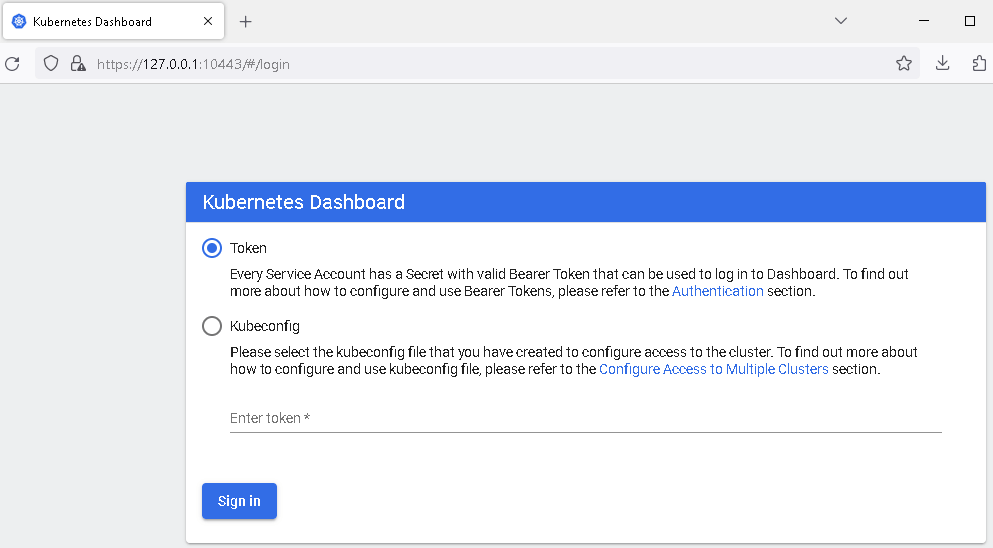
On the login page, select the “Token” option and paste the token copied from the previous step into the “Token” field.
By following these steps, you should be able to access the Kubernetes Dashboard in MicroK8s and view and manage your cluster using the web-based interface.
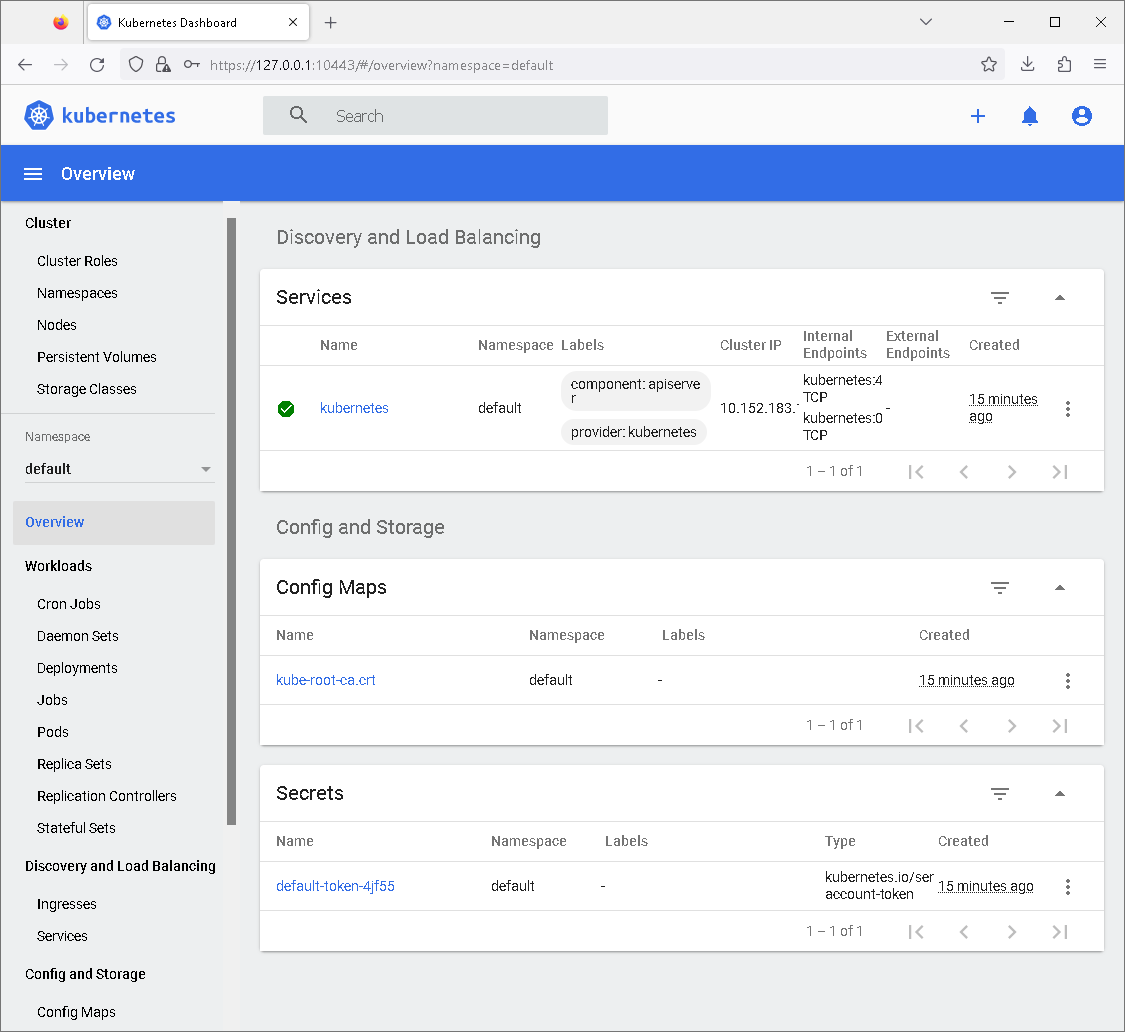
The Kubernetes Dashboard serves as a user-friendly interface for both developers and cluster administrators to interact with Kubernetes clusters without needing to use command-line tools like kubectl. It provides an accessible way to visualize and manage various aspects of the cluster, making it easier to understand and control the underlying infrastructure.